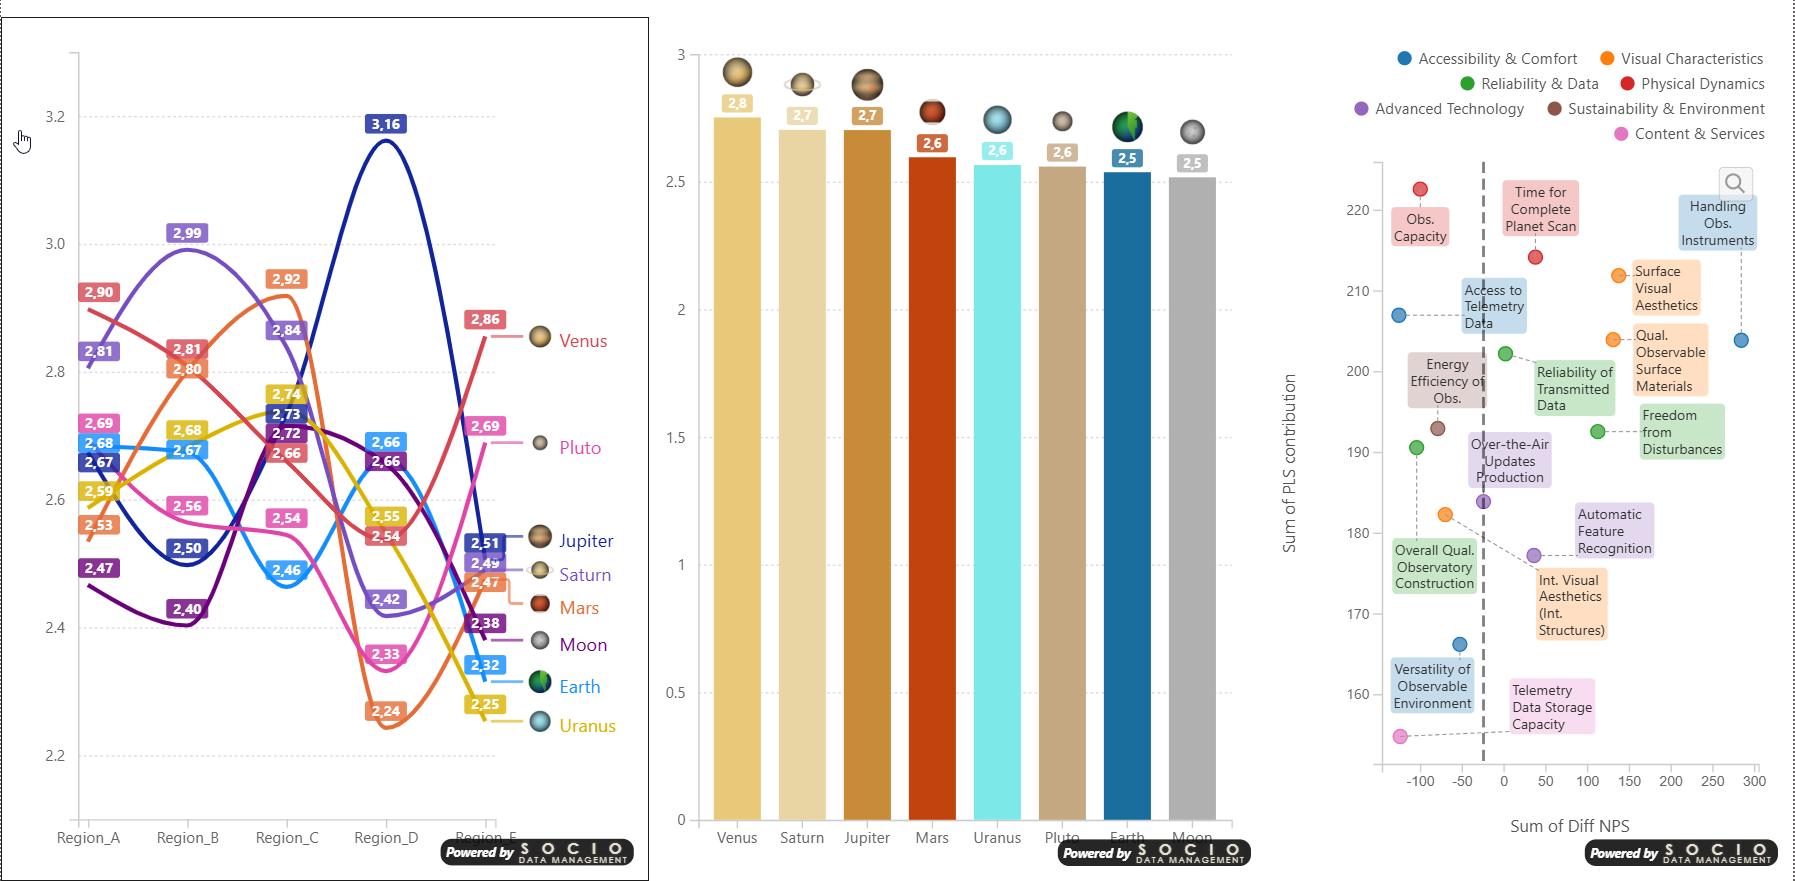
📊 Smart Column Chart
Grouped and stacked column/bar charts with data-driven colors, intelligent label placement, analytics pane, error bars, and cross-filtering.
Learn more →📈 Smart Line Chart
Multi-series line charts with markers, end-of-line labels, analytics overlays, error bars, and smart data label placement.
Learn more →⬤ Smart Scatter Plot
XY scatter plots with size encoding, legend grouping, zoom insets, analytics reference lines, and symmetry shading.
Learn more →