SDM Smart Graph Visuals
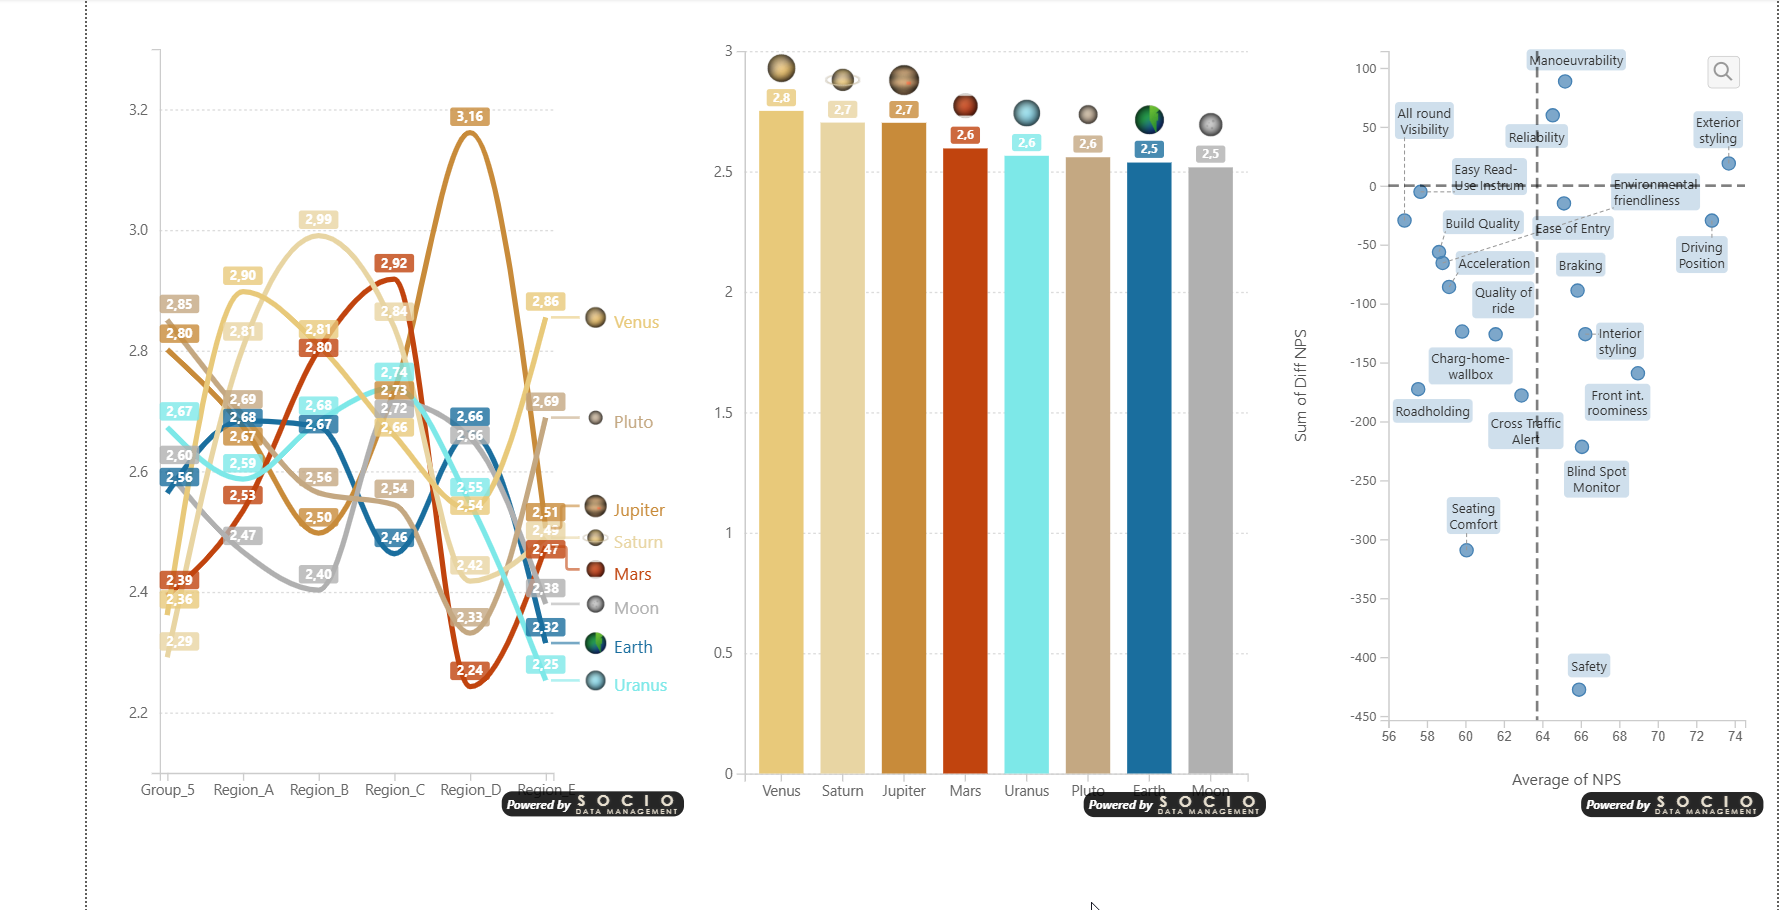
The SDM Smart Graph Visuals suite provides three professional-grade chart visuals for Power BI:
- Smart Column Chart — Grouped and stacked column/bar charts
- Smart Line Chart — Multi-series line charts with end-of-line labels
- Smart Scatter Plot — XY scatter plots with size encoding and zoom insets
Key Features
All three visuals share a common foundation:
| Feature | Column | Line | Scatter |
|---|---|---|---|
| Data-driven series colors | Yes | Yes | Yes |
| Series logos in legend | Yes | Yes | Yes |
| Configurable data labels | Yes | Yes | Yes |
| Per-series label visibility | Yes | Yes | — |
| Analytics pane (reference lines) | Yes | Yes | Yes |
| Error bars | Yes | Yes | — |
| Cross-filtering | Yes | Yes | Yes |
| Custom & native tooltips | Yes | Yes | Yes |
| Value formatting (source format) | Yes | Yes | Yes |
| 9 languages | Yes | Yes | Yes |
| Licensing & watermark | Yes | Yes | Yes |
Editions
| Feature | Free | Pro | Enterprise |
|---|---|---|---|
| All chart types | Yes | Yes | Yes |
| Data labels | Yes | Yes | Yes |
| Analytics pane | Yes | Yes | Yes |
| Error bars | Yes | Yes | Yes |
| Watermark | Shown | Hidden | Hidden |
| Support | Community | Priority |
Supported Languages
Arabic (ar-SA), German (de-DE), English (en-US), Spanish (es-ES), French (fr-FR), Hebrew (he-IL), Italian (it-IT), Portuguese (pt-PT), Chinese (zh-CN).