Smart Scatter Plot
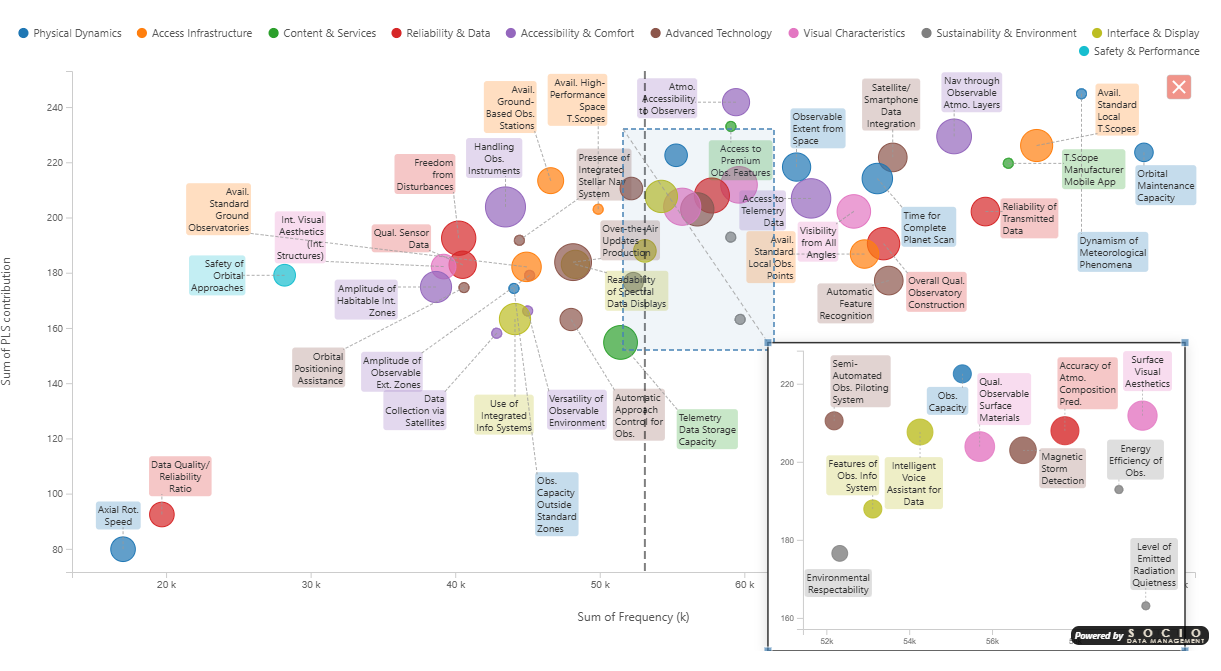
The SDM Smart Scatter Plot provides XY scatter visualization with size encoding, color measures, zoom insets, and analytics overlays.
Key Features
- Size encoding — Bubble size mapped to a measure
- Color measure — Data-driven point colors
- Legend grouping — Color-coded groups with per-category color pickers
- Logo markers — Replace geometric markers with per-point images from your dataset
- Zoom inset — Magnified view of a selected region
- Analytics — Reference lines on X and Y axes (with a "Both" option), symmetry shading, ratio lines
- Cross-filtering — Click to filter other visuals
- Labels — Configurable point labels with smart placement
Data Wells
| Data Role | Description |
|---|---|
| Values (Labels) | Grouping field for point labels |
| X Axis | Horizontal position measure |
| Y Axis | Vertical position measure |
| Legend | Color grouping field |
| Size | Bubble size measure |
| Tooltips | Additional tooltip measures |
| Color | Data-driven point color measure |
| Logo | Base64 image per legend value |