Percentage Series Configuration
Overview
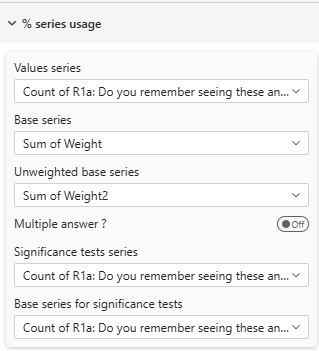
Configure which data series (measures) are used for different calculations in percentage tables. Proper series mapping is essential for accurate percentages, bases, and significance testing.
All series configuration is available in Free, Pro, and Premium editions.
Understanding Series
In Power BI, a series is a measure or calculated field that contains numerical data. For percentage tables, you need to map different series to different purposes:
- Value Series: The numerator (what you're counting)
- Base Series: The denominator (what you're dividing by)
- Additional Series: For significance testing and unweighted bases
Core Series Configuration
Value Series
Setting: Value Series
Required: Yes
Type: Dropdown (lists available measures)
The primary data series used to populate cell values.
What It Contains:
- For single response: Count of respondents selecting each option
- For multiple response: Count of respondents mentioning each item
- For weighted data: Weighted counts
Example:
If measuring product preference:
Value Series = "Count of Respondents"
or
Value Series = "Sum(WeightedResponses)"
Common Sources:
COUNT(ResponseID)SUM(Weight)COUNTROWS(Responses)- Pre-calculated measure from your data model
Base Series
Setting: Base Series
Required: For accurate percentages
Type: Dropdown (lists available measures)
The denominator used to calculate percentages.
What It Contains:
- Total count of respondents in each column
- Total population for the segment
- Weighted base (if using weights)
Calculation:
Percentage = (Value Series / Base Series) × 100
Example:
Column: Male Respondents
Value Series: 150 (males who chose Product A)
Base Series: 300 (total males)
Result: 150 / 300 = 50%
Common Sources:
COUNT(DISTINCT RespondentID)SUM(Weight)(for weighted base)- Pre-calculated base measure
Important: Base Series should match the scope of your analysis:
- For column percentages: Base = column total
- For row percentages: Base = row total
- For total percentages: Base = grand total
Unweighted Base Series
Setting: Unweighted Base Series
Required: Only if using weighted data
Type: Dropdown (lists available measures)
The raw count of respondents/records before any weighting adjustments.
When to Use:
- Your data is weighted (demographics, quotas, etc.)
- You need to show actual sample sizes
- For research transparency
What It Shows:
                Total    North    South
Weighted Base   1000     400      600
Unweighted      950      350      600  ← This row
Example:
Unweighted Base Series = "COUNT(DISTINCT RespondentID)"
(Counts actual people, ignoring weights)
Why It Matters:
- Shows actual sample size (reliability indicator)
- Required for professional research reporting
- Helps readers understand data confidence
Response Mode Configuration
Multiple Answer Mode
Setting: Multiple answer?
Type: Toggle
Default: Off
Controls how percentages are calculated for questions allowing multiple selections.
Single Response Mode (Toggle Off)
Used when respondents select one option only.
Characteristics:
- Column percentages sum to 100%
- Each respondent counted once per column
- Standard cross-tabulation
Example:
Question: "Which ONE product do you prefer?"

              Total    Male     Female
Base          1000     480      520
Product A     45%      42%      48%
Product B     35%      38%      32%
Product C     20%      20%      20%
Total         100%     100%     100%  ← Sums to 100%
Multiple Response Mode (Toggle On)
Used when respondents can select multiple options.
Characteristics:
- Column percentages may exceed 100%
- Each respondent can be counted multiple times
- Base = total respondents (not total mentions)
Example:
Question: "Which products do you use? (Select all)"

              Total    Male     Female
Base          1000     480      520
Product A     65%      60%      70%
Product B     45%      50%      40%
Product C     30%      35%      25%
Total         140%     145%     135%  ← Can exceed 100%
Calculation in Multiple Mode:
Percentage = (Count of respondents mentioning item / Total respondents) × 100
When to Use:
- "Select all that apply" questions
- Multiple choice questions
- Attribute tracking (features, behaviors, etc.)
Significance Testing Series
These series are used when performing statistical significance tests.
Significance Series
Setting: Significance Series
Required: Only if using significance tests
Type: Dropdown (lists available measures)
Available in: Pro, Premium
The data series used for calculating significance tests.
What It Should Contain:
- Same type of data as Value Series
- May be identical to Value Series
- Could be different if testing on different data
Common Scenarios:
Scenario 1: Same as Value Series
Value Series: "Sum(WeightedResponses)"
Significance Series: "Sum(WeightedResponses)"

Use when: Testing on the same weighted data you're displaying
Scenario 2: Different Series
Value Series: "Sum(WeightedResponses)" (for display)
Significance Series: "Count(Responses)" (for testing)

Use when: Display weighted but test unweighted
Why Separate?:
- Research methodologies may require testing on unweighted data
- Display and testing may use different rules
- Specialized weighting scenarios
Base Significance Series
Setting: Significance Base Series
Required: Only if using significance tests
Type: Dropdown (lists available measures)
Available in: Pro, Premium
The base used for calculating proportions in significance tests.
What It Should Contain:
- Denominator for significance calculations
- May match Base Series or be different
- Must align with Significance Series
Example:
Testing whether males differ from females on Product A preference:

Significance Series: Count(Males choosing A) = 150
Base Signif Series: Count(All Males) = 300
Proportion: 150/300 = 0.50

Compare to:
Significance Series: Count(Females choosing A) = 180
Base Signif Series: Count(All Females) = 400
Proportion: 180/400 = 0.45

Test: Is 0.50 significantly different from 0.45?
Common Configuration:
If using weighted data for display but unweighted for testing:

Base Series: "Sum(Weight)" (denominator for display %)
Base Signif Series: "COUNT(RespondentID)" (denominator for testing)
Series Mapping Strategy
Strategy 1: Simple Unweighted Data
Best for: Internal analysis, no weighting needed
Value Series: COUNT(Responses)
Base Series: COUNT(DISTINCT RespondentID)
Multiple Answer: As appropriate
Significance Series: (same as Value)
Base Signif Series: (same as Base)
Strategy 2: Weighted Data (Display Only)
Best for: Weighted reporting without statistical tests
Value Series: SUM(Weight)
Base Series: SUM(Weight)
Unweighted Base Series: COUNT(DISTINCT RespondentID)
Multiple Answer: As appropriate
Strategy 3: Weighted Data with Testing
Best for: Professional research with significance tests
Value Series: SUM(WeightedResponse)
Base Series: SUM(Weight)
Unweighted Base Series: COUNT(DISTINCT RespondentID)
Significance Series: COUNT(Response)
Base Signif Series: COUNT(DISTINCT RespondentID)
Multiple Answer: As appropriate
Strategy 4: Complex Weighting
Best for: Multiple weighting schemes, advanced research
Value Series: SUM(DisplayWeight)
Base Series: SUM(DisplayWeight)
Unweighted Base Series: COUNT(DISTINCT RespondentID)
Significance Series: SUM(TestWeight)
Base Signif Series: SUM(TestWeight)
Practical Examples
Example 1: Basic Survey (Unweighted)
Question: "How satisfied are you?" (Single choice)

Configuration:
- Value Series: "Count of Responses"
- Base Series: "Count of Respondents"
- Multiple Answer: No
- Significance: Not used

Result:
              Total    North    South
Base          1000     400      600
Very Sat      35%      40%      32%
Satisfied     45%      43%      47%
Neutral       15%      12%      17%
Unsatisfied   5%       5%       4%
Example 2: Weighted Research Study
Question: "Which brands do you recognize?" (Multiple)

Configuration:
- Value Series: "Sum(Weighted Recognition)"
- Base Series: "Sum(Weight)"
- Unweighted Base Series: "Count of Respondents"
- Multiple Answer: Yes
- Significance Series: "Count(Recognition)"
- Base Signif Series: "Count of Respondents"

Result:
                Total    Urban    Rural
Weighted Base   1000     650      350
Unweighted      1000     520      480
Brand A         68%      75%      55%
Brand B         45%      52%      32%
Brand C         30%      35%      20%
Total           143%     162%     107%  ← Multiple response
Example 3: Product Usage Tracking
Question: "Which features do you use?" (Select all)

Configuration:
- Value Series: "Count of Feature Mentions"
- Base Series: "Count of Users"
- Multiple Answer: Yes

Result:
              Total    Pro      Basic
Base          5000     2000     3000
Feature A     65%      85%      52%
Feature B     45%      70%      30%
Feature C     30%      55%      15%
Feature D     20%      40%      8%
Data Model Requirements
Required Measures
For proper percentage tables, ensure your data model includes:
1. Value Measure
Value = COUNTROWS(Responses)
or
WeightedValue = SUM(Responses[Weight])
2. Base Measure
Base = DISTINCTCOUNT(Responses[RespondentID])
or
WeightedBase = CALCULATE(SUM(Responses[Weight]), ALL(Responses[Response]))
3. Unweighted Base (if needed)
UnweightedBase = DISTINCTCOUNT(Responses[RespondentID])
4. Significance Measures (if testing)
SignifValue = COUNTROWS(Responses)
SignifBase = DISTINCTCOUNT(Responses[RespondentID])
Common Patterns
Pattern 1: Standard Survey Cross-Tab
Single choice question
No weighting
No significance testing

→ Value Series: Response count
→ Base Series: Respondent count
→ Multiple Answer: No
Pattern 2: Multiple Response Analysis
"Select all that apply" question
No weighting
No significance testing

→ Value Series: Mention count
→ Base Series: Respondent count
→ Multiple Answer: Yes
Pattern 3: Weighted Research
Weighted to population
Show both weighted and unweighted
No significance testing

→ Value Series: Weighted count
→ Base Series: Weighted base
→ Unweighted Base Series: Raw count
→ Multiple Answer: As appropriate
Pattern 4: Full Statistical Analysis
Weighted display
Unweighted testing
Statistical significance

→ Value Series: Weighted count
→ Base Series: Weighted base
→ Unweighted Base Series: Raw count
→ Significance Series: Unweighted count
→ Base Signif Series: Unweighted base
→ Multiple Answer: As appropriate
Troubleshooting
Q: Percentages don't add to 100%
A: Check your configuration:
- Single response: Verify Base Series matches column scope
- Multiple response: This is normal; ensure "Multiple Answer" is ON
Q: Percentages look wrong (too high/low)
A:
- Verify Value Series and Base Series are properly matched
- Check Base Series is at correct grain (respondent level, not response level)
- For weighted data, ensure both use same weight field
Q: Unweighted base is identical to weighted base
A: Your data likely isn't weighted; you can hide the unweighted row
Q: Base values don't match expectations
A:
- Check your measure definitions
- Verify filter context in DAX
- Ensure DISTINCTCOUNT on respondent ID, not response count
Q: Significance tests don't work
A:
- Verify Significance Series and Base Signif Series are mapped
- Check that measures return values
- Ensure series contain appropriate data for testing
Q: Can I use the same series for multiple purposes?
A: Yes, especially for simple unweighted data. Just select the same measure for Value/Base/Significance as appropriate.
Best Practices
- Match Series Properly: Value and Base must use same weighting
- Test Your Measures: Verify measures in a matrix visual first
- Document Your Setup: Note which series maps to what in your model
- Consistent Naming: Use clear measure names (e.g., "Weighted_Value", "Unweighted_Base")
- Validate Results: Check a few cells manually to ensure correct calculation
- Multiple Response: Always verify "Multiple Answer" setting matches question type
- Significance Setup: Test significance configuration on simple data first
Related Settings
- Table Contents — Overall table type and display
- Totals & Subtotals — How bases display in table
- Significance Testing — Configure statistical tests
- Mean Series — For mean table configuration
For more help, see the Quick Start Guide or contact support.