Totals & Subtotals Reference
Overview
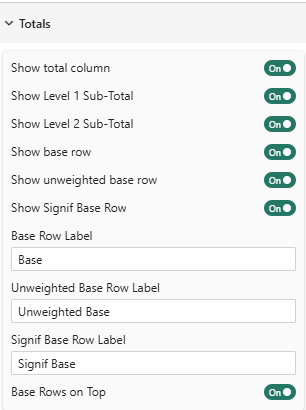
Configure total columns, base rows, and subtotals to provide context and summary information in your cross-tabulation tables.
Total Columns
Show Table Total Column
Setting: Show Table Total Column
Type: Toggle
Default: On
Displays a total column that sums all values across the table.
Position: Appears as the first column (leftmost) in the table
Example:

Use Cases:
- Quick reference to overall totals
- Comparing individual segments to total
- Understanding proportional contribution
Show Level 1 Sub-Total
Setting: Show Level 1 Sub-Total
Type: Toggle
Default: On
Displays subtotal columns for the first level of column hierarchy.
When It Appears: Only when you have hierarchical columns (multiple column levels)
Example:

The blue "Total" columns show Level 1 subtotals.
Show Level 2 Sub-Total
Setting: Show Level 2 Sub-Total
Type: Toggle
Default: On
Displays subtotal columns for the second level of column hierarchy.
When It Appears: Only when you have 3+ levels in column hierarchy
Example:
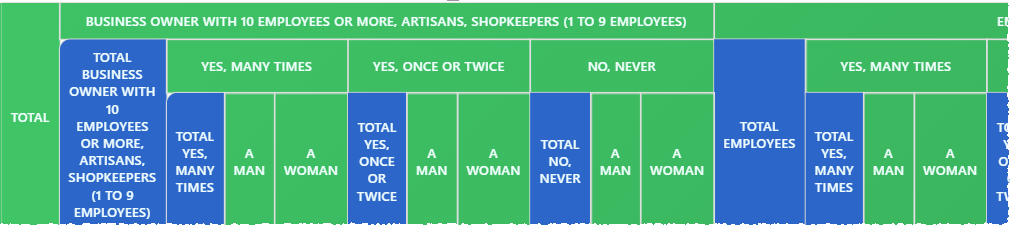
This example shows both Level 1 and Level 2 subtotal columns.
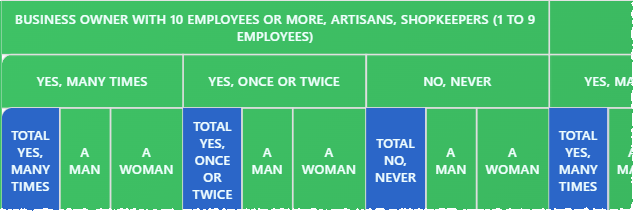
This example shows Level 2 subtotal columns without Level 1.
Base Rows
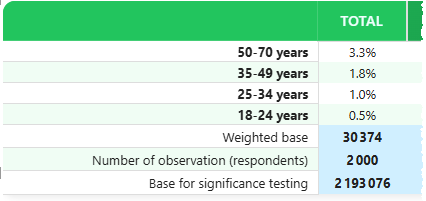
Base rows display the sample size or denominator used in calculations. Essential for understanding data reliability.

The example shows the three different base rows available.
Show Base Row
Setting: Show Base Row
Type: Toggle
Default: On
Displays a row showing the "Base" series selected in the Percentage Series setting or Mean Series setting.
What It Shows:
- For percentage tables: The denominator used to calculate percentages
- For mean tables: The count of observations
Example:

Why It Matters:
- Small bases = less reliable percentages
- Helps readers judge statistical significance
- Required for proper interpretation
Show Unweighted Base Row
Setting: Show Unweighted Base Row Type: Toggle Default: Off
Displays a row showing the unweighted (raw) sample size.
When to Use:
- When your data is weighted in base series
- For transparency in research reporting
- To show actual number of obeservations/respondents
Example:

Difference from Base:
- Base: Reflects weighting adjustments
- Unweighted: Raw count of records/respondents
Show Signif Base Row
Setting: Show Signif Base Row
Type: Toggle
Default: Off
Available in: Premium
Displays a separate base row used specifically for significance testing calculations.
This setting cannot be enabled unless you have set one significance method in the Significance Testing settings.
When to Use:
- When significance tests use different data than display values
- Complex weighting scenarios
- Specialized statistical testing
Example:

Row Labels
Customize the text labels for base rows.
Base Row Label
Setting: Base Row Label
Type: Text input
Default: "Base Row"
The label that appears for the weighted base row.
Common Labels:
- "Base"
- "Total N"
- "Sample Size"
- "Weighted Base"
- "n="
Example:


Unweighted Base Row Label
Setting: Unweighted Base Row Label
Type: Text input
Default: "Unweighted Base"
The label for the unweighted base row.
Common Labels:
- "Unweighted n"
- "Raw Base"
- "Actual Count"
- "Sample (unwtd)"
Signif Base Row Label
Setting: Signif Base Row Label
Type: Text input
Default: "Signif Base"
Available in: Premium
The label for the significance testing base row.
Common Labels:
- "Signif n"
- "Test Base"
- "Statistical Base"
Row Positioning
Base Rows on Top of Table
Setting: Base Rows on Top
Type: Toggle
Default: On
Controls whether base rows appear at the top or bottom of the table.
On (Default): Base rows appear immediately below headers
Off: Base rows appear at the bottom
Best Practices:
- Top: Better for reports where base size is critical (research, surveys)
- Bottom: Cleaner look for executive dashboards
- Top: Standard in market research industry
Practical Examples
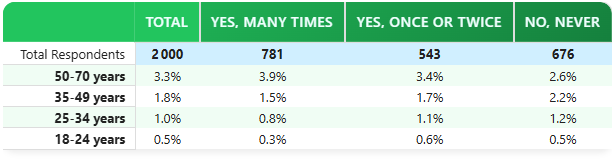
Example 1: Basic Survey Table
Configuration:
- Show Table Total Column: Yes
- Show Base Row: Yes
- Base Row Label: "Total Respondents"
- Base Rows on Top: Yes
Result:
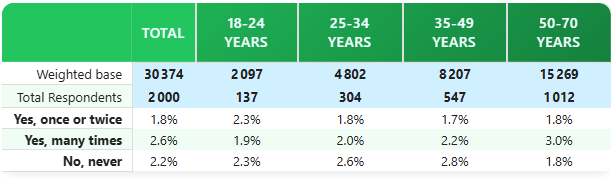
Example 2: Weighted Research Study
Configuration:
- Show Table Total Column: Yes
- Show Base Row: Yes
- Show Unweighted Base Row: Yes
- Base Row Label: "Weighted Base"
- Unweighted Label: "Unweighted Base"
- Base Rows on Top: Yes
Result:
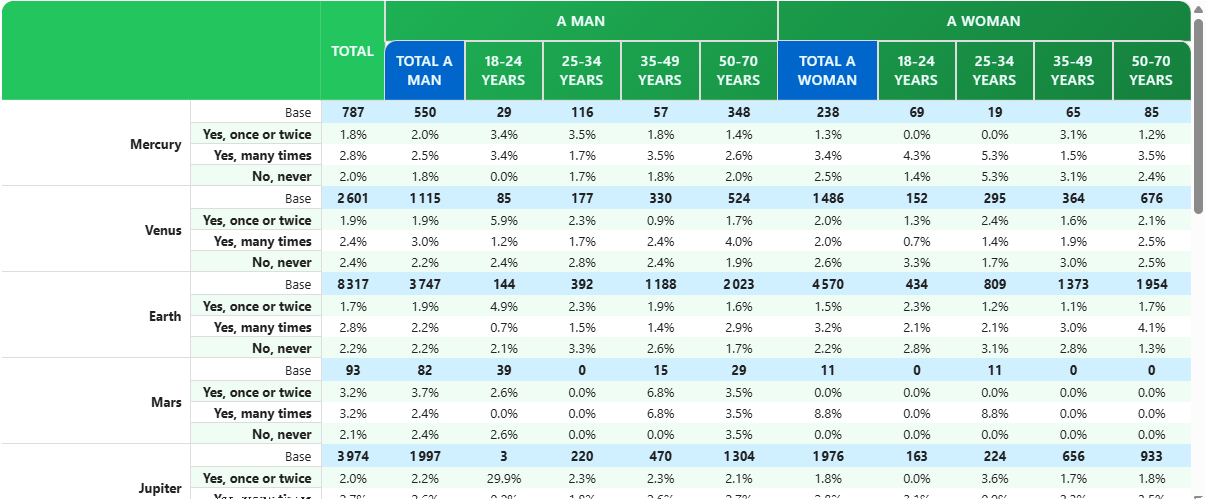
Example 3: Multiple Row/Columns Analysis
Configuration:
- Show Table Total Column: Yes
- Show Level 1 Sub-Total: Yes
- Show Level 2 Sub-Total: Yes
- Show Base Row: Yes
- Base Rows on Top: Yes
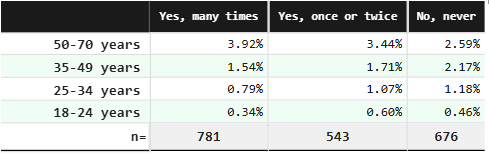
Example 4: Clean Dashboard Style
Configuration:
- Show Table Total Column: No
- Show Base Row: Yes
- Base Row Label: "n="
- Base Rows on Top: No
- Table Style: Market research
Best Practices
1. Always Show Base Rows
Base rows are critical for proper interpretation. Only hide them if:
- Space is extremely limited
- Audience is very familiar with the data
- Bases are identical across all columns
2. Unweighted Bases for Research
When reporting weighted data:
- Always show both weighted and unweighted bases
- Label them clearly to avoid confusion
- Place unweighted base directly below weighted base
3. Label Clarity
Use industry-standard labels:
- Market Research: "Base", "Unweighted Base"
- Academic: "N", "n (unweighted)"
- Business: "Total", "Sample Size"
4. Position Based on Audience
- Research/Technical: Bases on top
- Executive/Business: Consider bases on bottom
- Reports with many rows: Bases on top for reference
5. Subtotals in Hierarchies
Enable Level 1 and Level 2 subtotals when:
- You have 2+ levels of column grouping
- Subtotals provide meaningful insights
- Table isn't too wide already
Common Configurations
Standard Market Research
- Show Table Total: Yes
- Show Base Row: Yes
- Show Unweighted Base: Yes
- Base Label: "Weighted Base"
- Unweighted Label: "Unweighted Base"
- Position: Top
Business Dashboard
- Show Table Total: No (or Yes, depends)
- Show Base Row: Yes
- Base Label: "Total"
- Position: Top or Bottom
- Level 1 Subtotals: As needed
Academic/Scientific
- Show Base Row: Yes
- Show Unweighted Base: No (unless weighted)
- Base Label: "N"
- Position: Top
- Include significance testing base if relevant
Executive Summary
- Show Table Total: Yes
- Show Base Row: Yes
- Base Label: "Sample"
- Position: Bottom
- Minimal detail, clean look
Data Series Configuration
For base rows to display correctly, ensure proper series mapping:
For Percentage Tables
- Base Series: Set in "% series usage" settings
- Unweighted Base Series: Set in "% series usage"
- Signif Base Series: Set in "% series usage" (if using significance)
For Mean Tables
- Count Series: Set in "Mean series usage" (acts as base)
- Unweighted Base Series: Set in "Mean series usage"
See Percentage Series and Mean Series for detailed configuration.
Statistical Context
Why Base Sizes Matter
Small Bases (<30):
- Percentages are unreliable
- Use thresholds to mask or warn
- Consider combining categories
Medium Bases (30-100):
- Percentages acceptable but note limitations
- Significance tests may not detect real differences
Large Bases (100+):
- Reliable percentages
- Significance tests have good power
Weighted vs Unweighted
Weighted Base:
- Adjusted to match population proportions
- Use for percentage calculations
- May differ significantly from raw count
Unweighted Base:
- Actual number of records/respondents
- Use to judge reliability
- Important for transparency
Rule of Thumb: Show both when weighting is applied.
Troubleshooting
Q: Base row doesn't appear
A: Ensure you've mapped the Base Series in percentage/mean series settings
Q: Unweighted base is identical to weighted base
A: Your data likely isn't weighted; consider hiding unweighted row
Q: Base values look wrong
A: Check series mapping; ensure you're using the correct measure
Q: Subtotals don't appear
A: Subtotals only show with hierarchical column structures (2+ levels)
Q: Can I show bases in cells instead of rows?
A: No, bases are always shown as separate rows; consider custom formatting
Q: Base rows break my table layout
A: Try positioning them at bottom, or reduce font size in formatting
Related Settings
- Table Contents — Overall table configuration
- Percentage Series — Map base data series
- Mean Series — Configure count series
- Thresholds — Mask low base values
For more help, see the Quick Start Guide or contact support.