Ranking Settings Reference
Overview
Automatically rank cells within each column and visualize rankings with numbers, colors, or gradients.
Ranking is available in Pro and Premium editions.
Enable Ranking
Do Ranking
Setting: Do ranking
Type: Toggle
Default: Off
Available in: Pro, Premium
Turns ranking on/off for all cells in the table.
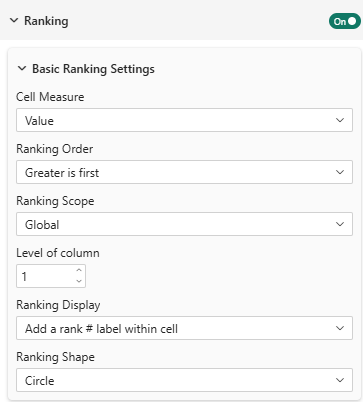
Ranking Configuration
Cell Value Property
Setting: Cell value
Type: Dropdown
Options: Value, Horizontal Percentage, Indice
Default: Value
Which metric to rank by within each column.
the metric used for ranking DOES NOT need to be displayed in the table. You can rank on one metric while displaying another.
It is an interesting feature to sort on a specific measure but to rank on another measure like 'Sorting my metric vertical percentage but rank on indice'.
Because Vertical Percentage is calculated based on column totals, ranking by Value and Vertical Percentage yield exactly the same order. Therefore, only 'Value', 'Horizontal Percentage', and 'Indice' options are shown.
Ranking Order
Setting: Ranking order
Options: Greater is first, Lesser is first
Default: Greater is first
Determines what's considered "best" (rank #1).
- Greater is first: Highest values get rank 1 (sales, satisfaction, etc.)
- Lesser is first: Lowest values get rank 1 (costs, errors, etc.)
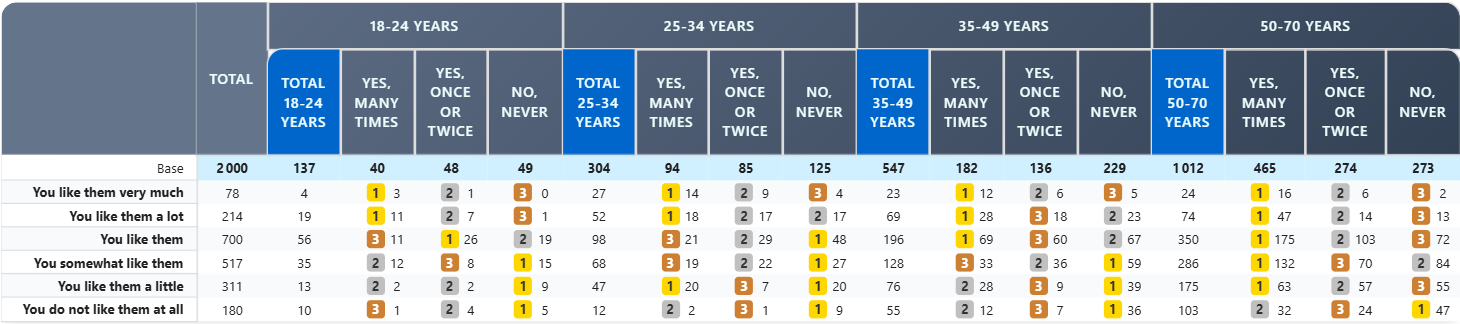
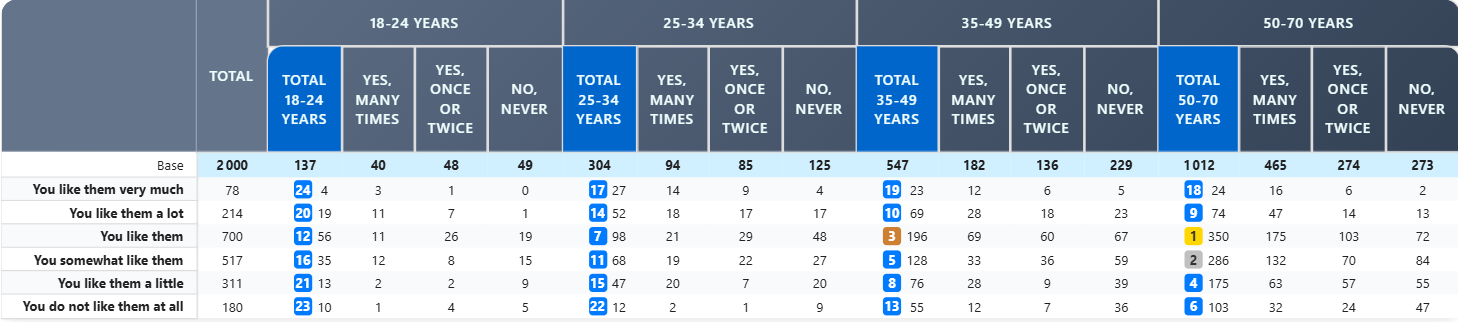
Ranking Scope
Setting: Ranking scope
Options: Global, Per Column, Per Row
Default: Global
Determines how-to rank the cells.
- Global: Ranks all cells in the table together
- Per Column: Ranks cells within each column separately
- Per Row: Ranks cells within each row separately
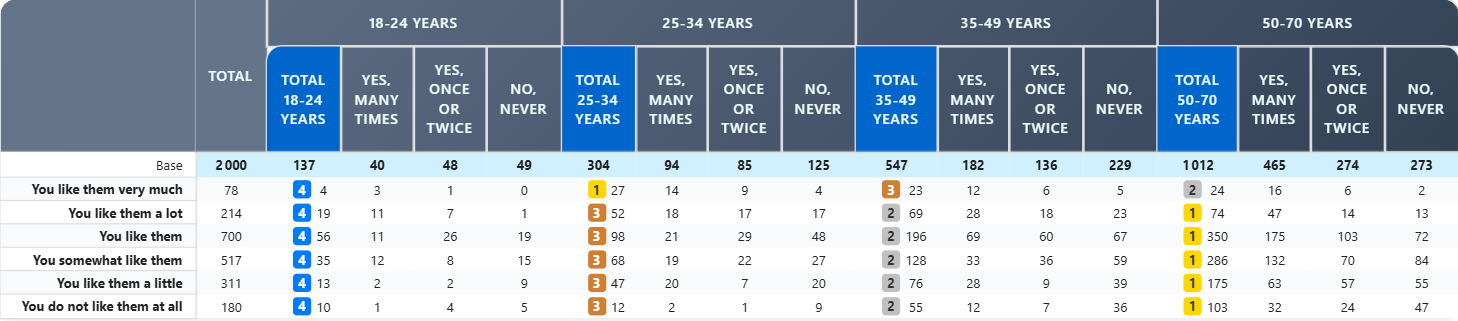
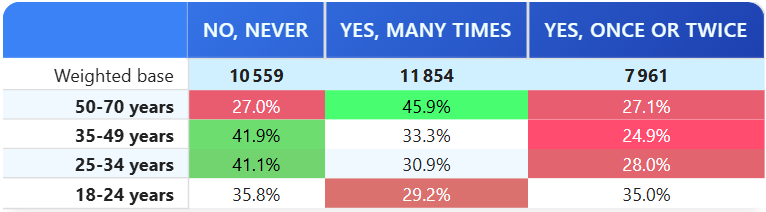
Examples: Ranking per column:
See level of column setting below to choose which column level to consider for Global and Per Row ranking.
Level of Column for Global and per-row ranking
Setting: Level of column
Options: From 0 to N (N = number of column levels - 1)
Default: 1
When using "Global" or "Per Row" ranking scope, choose which column level to consider for ranking.
- Level 0: Total of all columns (global or per-row)
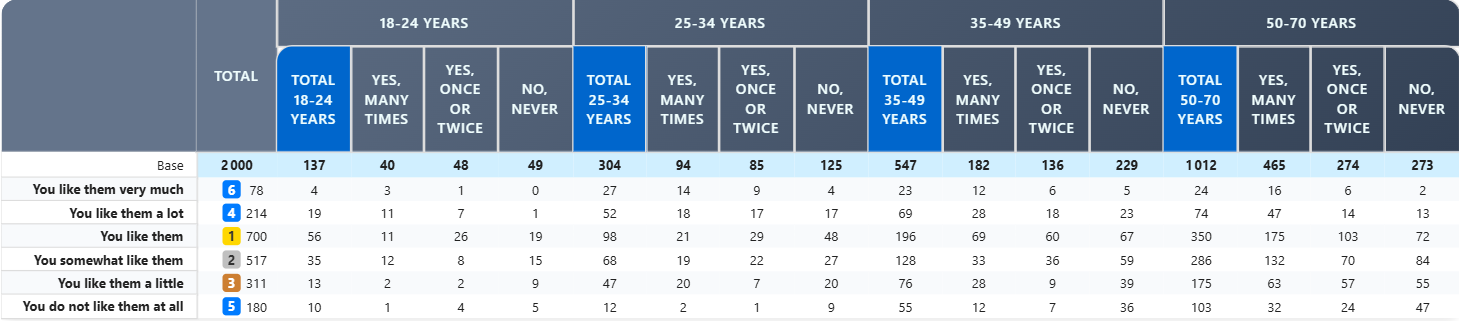
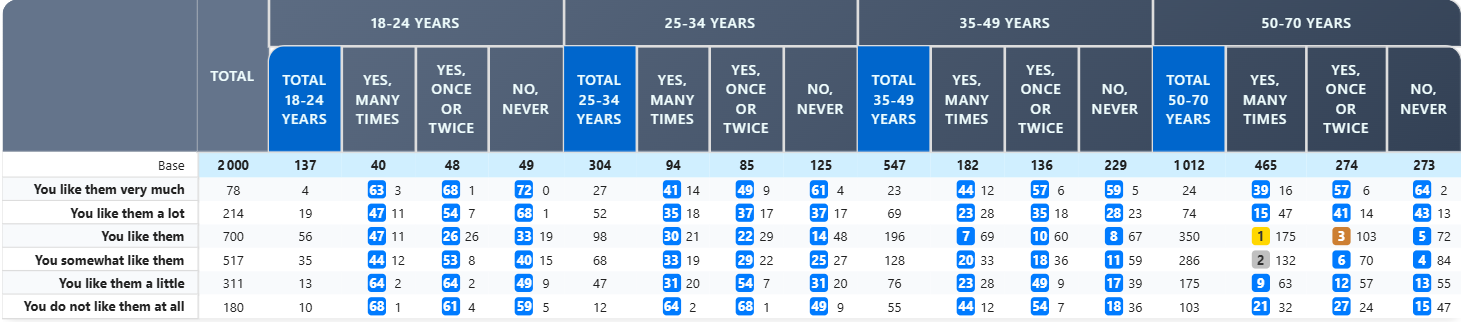
- Level 1: First level of columns - global
- Level 1: First level of columns - per row
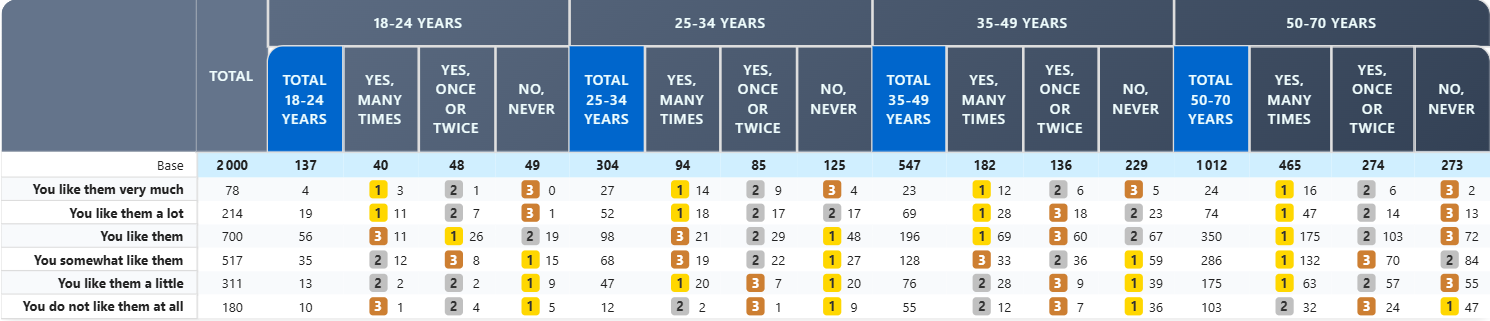
- Level N: Nth level of columns - global
- Level N: Nth level of columns - per row
Ranking Display Options
Display Format
Setting: Ranking display
Options:
- Add a rank # label within cell
- Color from Red to Blue
- Color from Red to Green
- Custom color gradient
Default: Add a rank # label
Rank Label
Shows a numbered badge (1, 2, 3...) in cells. Choose the shape:
Shape Options:
- Circle: Round badge
- Square: Square badge
- Rounded Square: Square with rounded corners
Example:

Color Gradients
Red to Blue:
- Red = lowest rank
- Blue = highest rank
- Good for neutral comparisons
Red to Green:
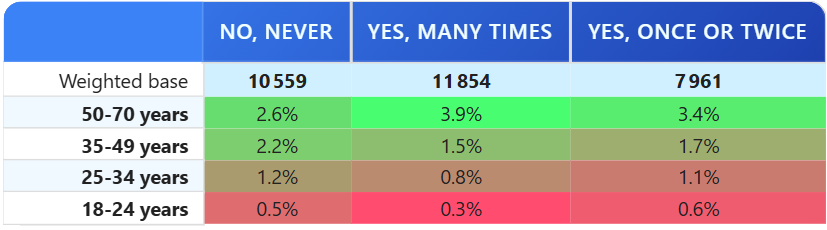
- Red = low/bad
- Green = high/good
- Commonly understood for positive/negative
Custom Color Gradient:
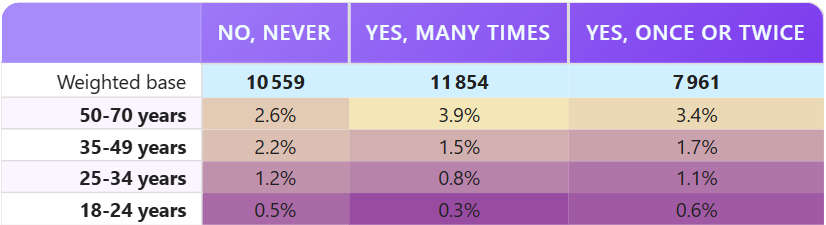
- Define your own start and end colors
- Full control over color scheme
Color-Based Ranking Settings
When using color display, configure these additional options:
Color Strength
Setting: Color strength
Type: Slider (1-10)
Default: 7
Controls how saturated/intense the ranking colors are.
- 1-3: Subtle colors, barely noticeable
- 4-7: Standard intensity
- 8-10: Bold, highly visible colors
Use Value for Color
Setting: Use value for color
Type: Toggle
Default: Off
Normally, colors are based on rank position (rank 1, 2, 3...). Enable this to base colors on actual cell values instead.
Example:
Without this option:
- Rank 1 (value 95%) = Dark green
- Rank 2 (value 94%) = Light green
- Rank 3 (value 50%) = Light red  ← Same color!

With this option:
- Value 95% = Dark green
- Value 94% = Light green
- Value 50% = Dark red  ← Different color
Auto Font Color
Setting: Auto font color
Type: Toggle
Default: Off
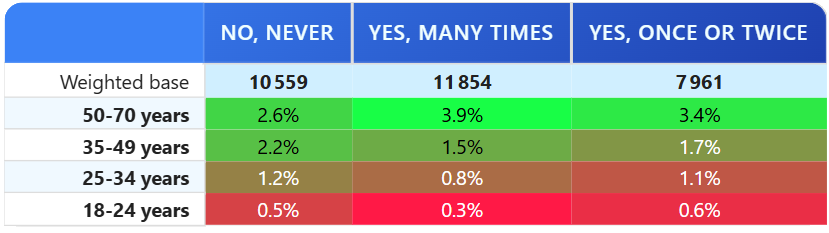
Automatically adjust text color (black/white) based on background color for better readability.
Useful for: Color-based gradients to ensure text is always readable
Exclude Middle Range (Advanced)
Exclude certain values from being colored/ranked, useful for "neutral" zones.
Prevent Middle Range from Coloring
Setting: Prevent middle range from coloring
Type: Toggle
Default: Off
Available in: Premium
When enabled, values between two thresholds are left uncolored.
Exclude Range
When "Prevent middle range" is enabled:
Exclude From (Start value)
Exclude To (End value)
Values in this range remain neutral (no color or styling).
Example:

Custom Color Gradient
Available in Premium edition with "Custom color gradient" display option.
Color From
Type: Color picker
Default: White
The color for lowest-ranked values.
Color To
Type: Color picker
Default: Black
The color for highest-ranked values.
Practical Examples
Example 1: Sales Performance (Pro Edition)
Configuration:
- Enable Ranking: Yes
- Ranking Order: Greater is first
- Display Format: Color from Red to Green
- Color Strength: 8

Result: Top-selling regions show in green,
        lower performers in red within each column
Example 2: Cost Analysis
Configuration:
- Enable Ranking: Yes
- Ranking Order: Lesser is first (lower costs = better)
- Display Format: Add rank # label
- Shape: Circle

Result: Cost leaders show as [1], [2], [3]
        within each category
Example 3: Satisfaction with Neutral Zone
Configuration:
- Enable Ranking: Yes
- Display Format: Color from Red to Green
- Prevent middle range: Yes
- Exclude from: 45
- Exclude to: 55

Result: Scores below 45% = red (poor)
        45-55% = neutral (no color)
        Above 55% = green (good)
Example 4: Custom Brand Colors (Premium)
Configuration:
- Enable Ranking: Yes
- Display Format: Custom color gradient
- Color From: #FF9999 (light brand red)
- Color To: #99FF99 (light brand green)

Result: Table ranks with custom brand colors
Best Practices
- Choose Appropriate Order: "Greater is first" for positive metrics, "Lesser is first" for costs/errors
- Keep It Simple: Use ranks OR colors, not both simultaneously
- Color Strength: Use 7-8 for reports, 5-6 for dense data tables
- Font Color: Enable auto font color with strong gradients
- Neutral Zones: Use exclude range for naturally neutral metrics (satisfaction 40-60% might be "neutral")
- Test Accessibility: Ensure colors are distinguishable for color-blind readers
Troubleshooting
Q: Rankings show but colors aren't appearing
A: Check that you've selected a color display option (not "rank label")
Q: Color gradient goes the wrong direction
A: Verify "Ranking Order" matches your expectations (Greater/Lesser)
Q: Rank numbers are hard to read
A: Enable "Auto Font Color" or adjust colors in formatting
Q: Values seem to rank incorrectly
A: Check that "Cell value" property matches your intention (Value, %, Indice)
For more help, see the Quick Start Guide.