Significance Testing Reference
Overview
The Socio Data Management Power BI cross table tool lets you identify statistically significant differences between groups in your data in several manner, depending on your edition (Pro or Premium) and configuration. All feattures includes:
- Two independent significance tests per table
- Multiple test types (All columns, Item vs other, Item vs total, Regex)
- Various display options (icon, font color, background color, border color)
- Configurable confidence levels (90%, 95%, 99%)
- Configurable variance methods for percentage tables (pooled, separate)
- Basic significance: Available in Pro edition
- Advanced significance: Available in Premium edition
Test Configuration
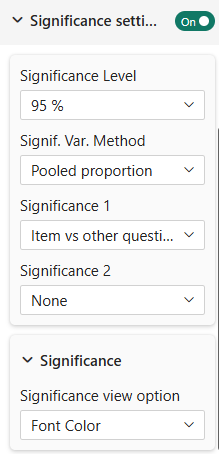
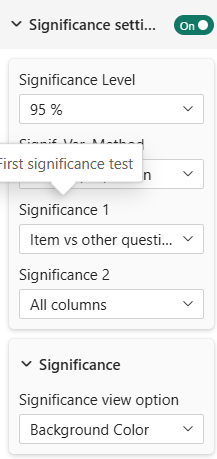
Significance Test 1
Setting: Significance 1
Options: None, All columns, Item vs other question item, Item versus Total (Base), Regular expression
Default: None
Significance Test 2
Setting: Significance 2
Options: Same as above
Default: None
Each test compares different aspects of your data.
Test Types Explained
None
No significance testing is performed.
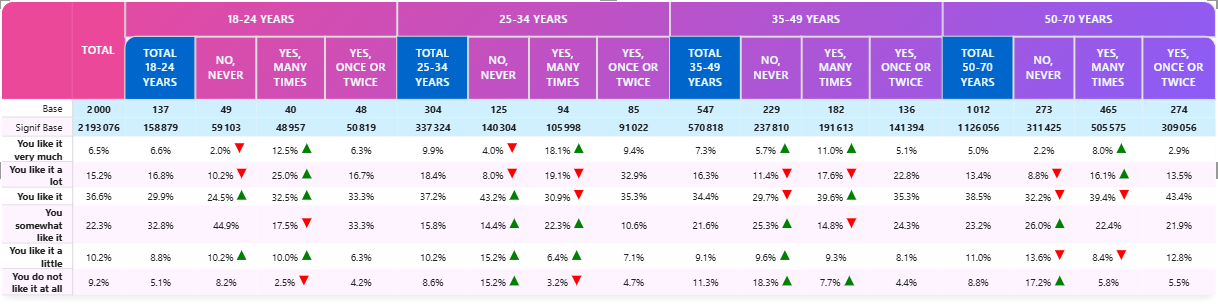
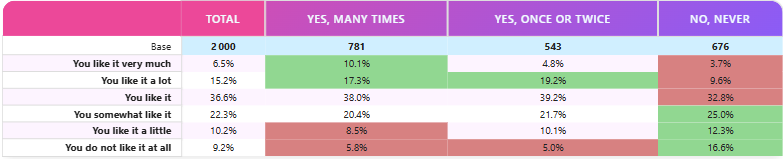
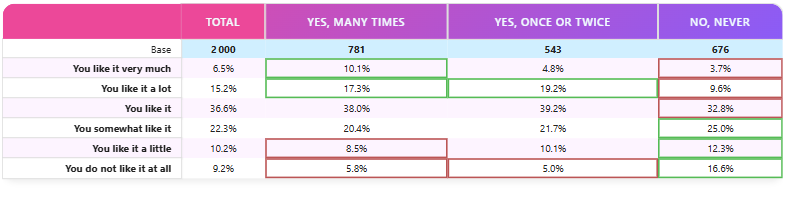
All Columns
Compares each column against all others in the table.
ABCDEFGHIJKLMNOPQRSTUVWXYZabcdefghijklmnopqrstuvwxyzαβγδεζηθικλμνξοπρστυφχψωΓΔΘΛΞΠΣΦΨΩ🅰🅱🅲🅳🅴🅵🅶🅷🅸🅹🅺🅻🅼🅽🅾🅿🆀🆁🆂🆃🆄🆅🆆🆇🆈🆉ⓐⓑⓒⓓⓔⓕⓖⓗⓘⓙⓚⓛⓜⓝⓞⓟⓠⓡⓢⓣⓤⓥⓦⓧⓨⓩ
Use Case: Determine which regions have significantly different satisfaction scores
Example:
 |  |
Note that when you have more than one level of column, the significance markers will appear differently per level to avoid confusion.
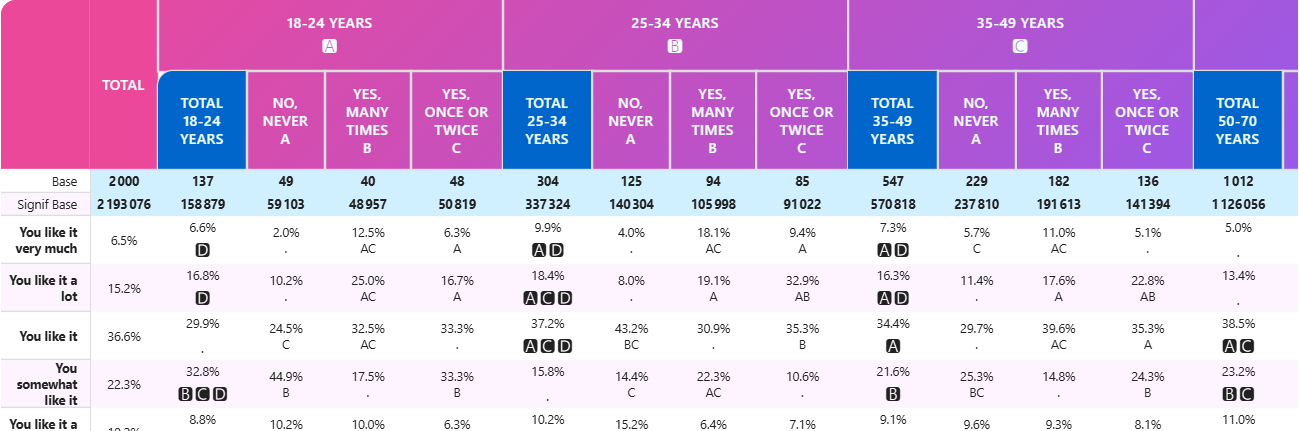
Available in Pro and Premium editions.
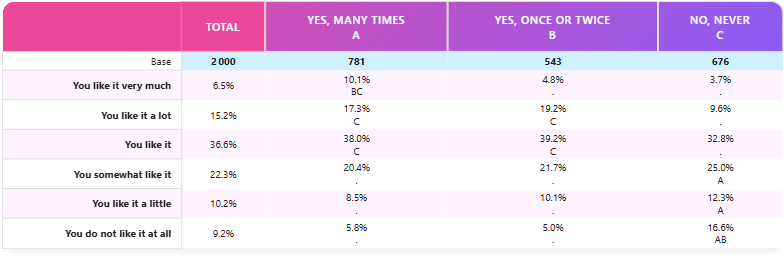
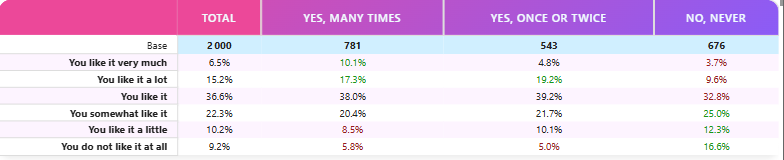
Item vs Other Question Item
Compares one response option against all others.
This test is the most used for survey data analysis. You should always prefer this test vs 'Against Total' when comparing response options.
Use Case: Highlight if one product preference is significantly different
Example:
Available in Pro and Premium editions.
Item versus Total (Base)
Compares each item to the overall average at the same level.
This test has been implemented for legacy purpose and is not generally recommended for any analysis. The reason is that observation (population) of the tested values should always be independent. In this test the observations of each cell is included in the total so it does not ensure this independency rule. Unless you have a good reason, prefer the 'Item vs Other Question Item' test instead.
Available in Pro and Premium editions.
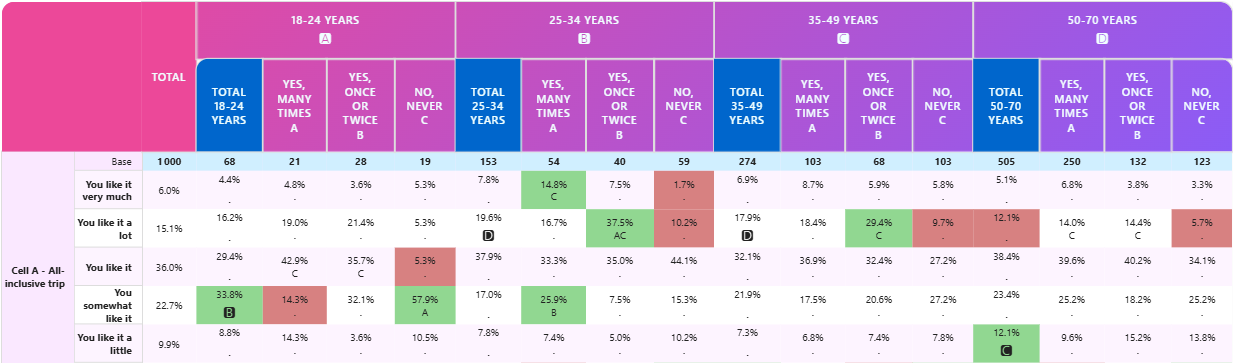
Regular Expression
Uses a regex pattern to identify columns to compare.
This option is extremely useful when you are focusing on a brand, a population or a product and want to know which "competitors" are significantly lower or higher.
Example 1: You want to compare the age group "50-70 years" against all other age groups in a satisfaction survey.
In this example, we have two levels of columns but the regex matches only one item on the first level (50-70):
 | 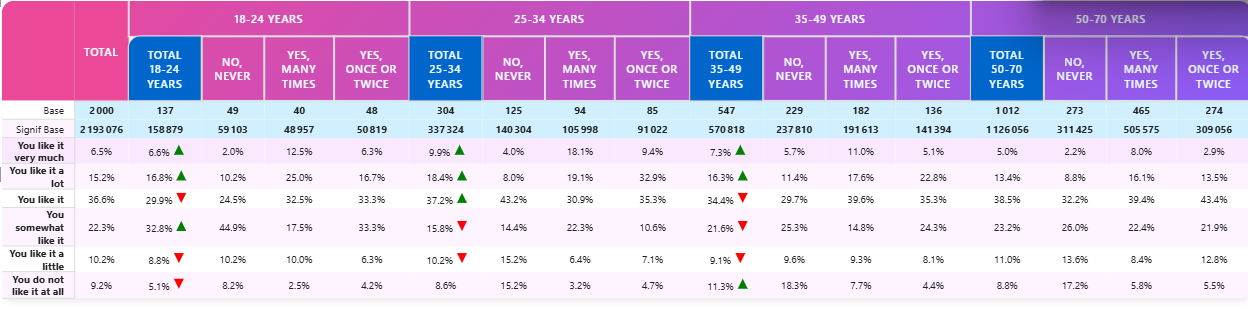 |
The regex pattern used here is 50-70 which matches partially the column with label "50-70 years".
Example 2: You want to compare respondents who answered "yes, once or twice" against all other response options in a survey question split by age groups.
In this second example, we match on level two, "yes, once" ich matches columns "Yes, once or twice" under each age group: In this case, only every columns compares to this matched column in each subgroup:
 | |
Available in Premium edition only.
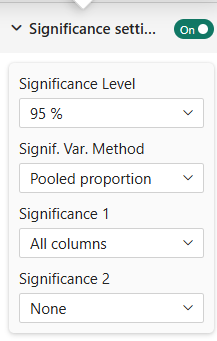
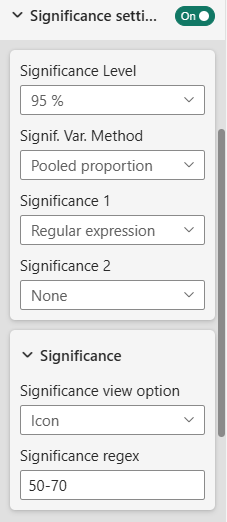
Confidence Level
Significance Level
Setting: Significance level
Options: 90%, 95%, 99%
Default: 95%
The confidence threshold for determining significance.
- 90%: More lenient (flags more differences)
- 95%: Standard business level
- 99%: Strict scientific standard
You usually do not change this settings. Choose a higher level (99%) for critical decisions.
Variance Method (Percentage Tables Only)
Setting: Signif. Var. Method
Options: Pooled proportion, Separate proportion
Default: Pooled
Available in: Pro, Premium
How variance is calculated when comparing percentages.
- Pooled: Treats all groups as one population (more conservative)
- Separate: Treats groups separately (more sensitive to differences)
In usual situation, leave the default to Pooled proportion.
Choose Separate proportion option when group sizes differ greatly.
Display Options
View Option
Setting: Significance view option
Options: Icon, Font Color, Background Color, Cell border Color
Default: Icon
How significant values are marked:
Icon: Small symbol/marker appears in cell (Red for significantly lower, Green for significantly higher)
Font Color: Text color changes red or green to highlight significance
 |  |
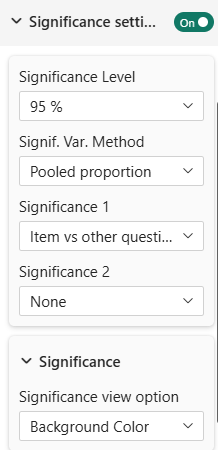
Background Color: Cell background changes red or green to highlight significance
 | |
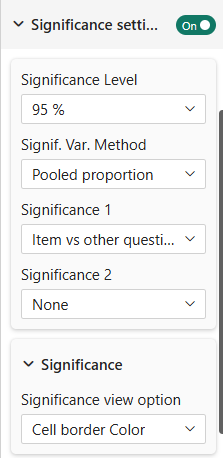
Border Color: Cell border changes red or green to highlight significance
 |  |
Advanced Testing (Premium Only)
Multiple Test Configuration
In Premium edition, you can configure each test independently:
- Different display methods for each test
- Different test types simultaneously
- Regex patterns for flexible comparison
 |  |
Hide First Variable
Hides the first variable in comparative displays for cleaner visuals (see masking in table-content).
Statistical Background (For Reference)
What Tests Are Used?
For percentage tables: Chi-square test of independence
For mean tables: T-tests or ANOVA (depending on number of groups)
Interpretation
A cell marked as significant means:
- The difference between groups is unlikely due to chance
- At the chosen confidence level
- Given the sample sizes
Important Notes
- Significance depends on sample size (large samples show more differences)
- Practical significance ≠ statistical significance (a 1% difference might be statistically significant but not practically important)
- Always consider context, not just statistics
Series Configuration for Testing
Significance tests require special data series:
For Percentage Tables:
- Significance Series: The counts/values used for testing
- Base Series: The total base for calculating proportions
For Mean Tables:
- Mean Series: The mean values to test
- Standard Deviation Series: Measure of variability
- Count Series: Sample size
Configure these in data settings under:
- "Significance Series" (percentage tables)
- "Mean Series for Significance" (mean tables)
Best Practices
- Choose Appropriate Test: Match test type to your question (all columns vs vs-total)
- Clear Display: Use one view option per test for clarity
- Document Level: Note which significance level you're using in reports
- Consider Sample Size: Small sample sizes can miss real differences
- Practical Significance: Don't rely solely on statistics; consider business context
Troubleshooting
Q: Significance markers don't appear
A: Ensure you've configured significance series in data settings
Q: All cells are marked significant
A: Your significance level might be too lenient (90%); try 99%
Q: No cells marked significant
A: Check sample sizes; very small groups won't show significance
Q: Significance test types are grayed out
A: Significance testing requires Pro or Premium edition
For more help, see the Quick Start Guide or contact support.