Series Colors & Logos
All three SDM Smart Graph Visuals support data-driven series colors and series logos. Instead of relying on Power BI's default color palette and plain text legends, you can control the exact color and display a custom logo for each series — directly from your data model.
This is one of the key differentiators of the SDM Smart Graph Visuals compared to Power BI's built-in charts.
Overview
| Feature | Column Chart | Line Chart | Scatter Plot |
|---|---|---|---|
| Series Color | Yes | Yes | Yes |
| Logo in legend | Yes | Yes | Yes |
| Logo in bars | Yes | — | — |
| Logo in end-of-line labels | — | Yes | — |
Preparing Your Data
The recommended approach is to create a lookup table containing one row per series, with a color column and a logo column.
Step 1 — Create the source table
Create a table (in Excel or any data source) with at least three columns:
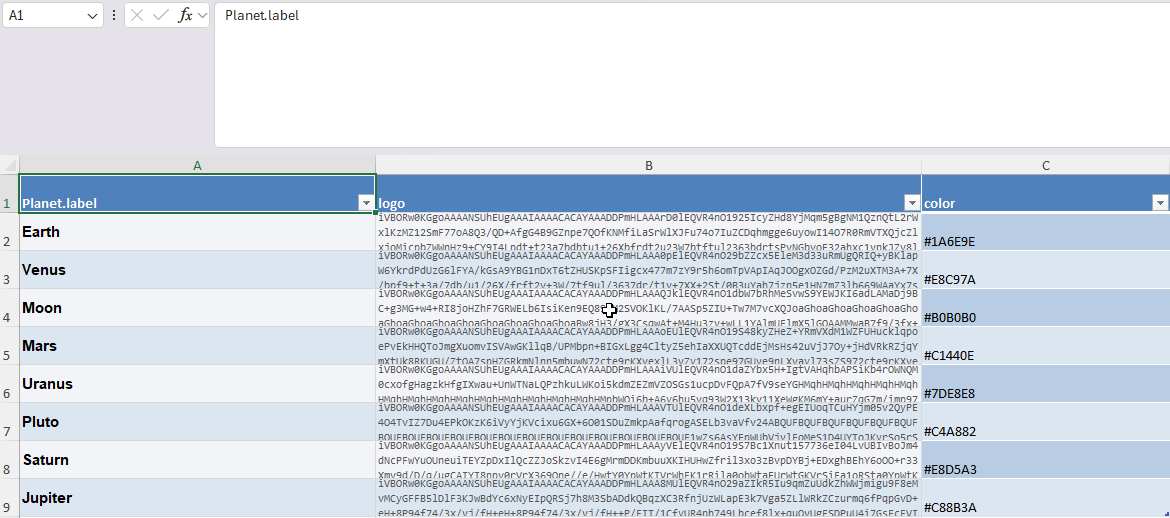
| Column | Description | Example |
|---|---|---|
| label | The series identifier (must match your Legend field values) | Earth |
| color | Hex RGB color code | #4682B4 |
| logo | Base64-encoded image | data:image/png;base64,iVBOR... |
Colors must be expressed in hexadecimal RGB format (e.g. #FF6347). Other formats like rgb(255,99,71) or color names like red are not supported.
Logo images must be Base64-encoded. You can generate Base64 strings using:
- AI tools — Ask an AI assistant to generate a simple icon as base64
- Free online converters — Search for "image to base64 converter"
- GIMP plugins — Export as base64 from GIMP
- The Python script provided below in this guide
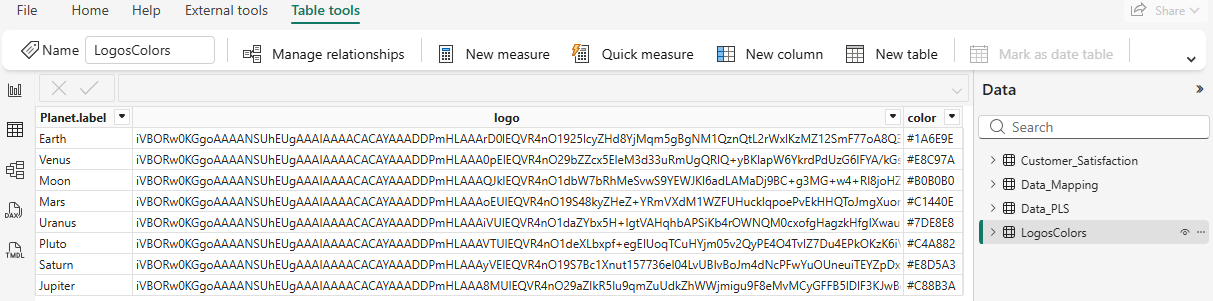
Step 2 — Load the table in Power BI
Import the lookup table into your Power BI model alongside your main data table.
Step 3 — Create DAX measures
Create two measures in your destination table to look up the color and logo for each series:
planet_color = LOOKUPVALUE(
    LogosColors[color],
    LogosColors[Planet.label],
    SELECTEDVALUE(Customer_Satisfaction[Planet.Label])
)
planet_logo = LOOKUPVALUE(
    LogosColors[logo],
    LogosColors[Planet.label],
    SELECTEDVALUE(Customer_Satisfaction[Planet.Label])
)
Step 4 — Assign to data wells
Drag your color measure into the Series Color data well and your logo measure into the Logo data well.
Expected result
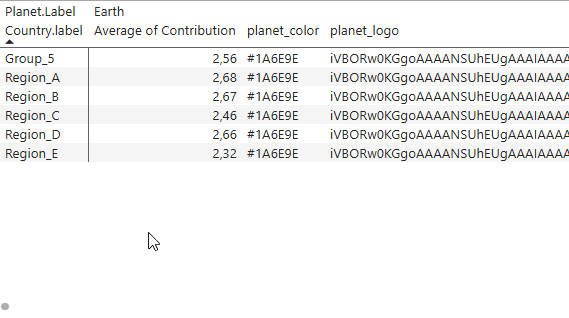
When configured correctly, Power BI displays the resolved data as a matrix:
- Rows — correspond to the Axis field (e.g.
Country.label) - Column headers — correspond to the Legend field (e.g.
Planet.Label) - For each combination, the visual receives the value from the Values field, the color from the Series Color measure, and the logo from the Logo measure.
Color Resolution Priority
Colors are resolved in this order (highest priority first):
- Per-series conditional formatting (fx) — Rules set in the Data Colors card
- Series Color data role — Hex codes from your data model
- Power BI theme palette — The theme's automatic color assignment
- Default fallback — Built-in 10-color array
Logo Display Locations
Once logos are loaded via the Logo data role, they can appear in multiple places depending on the visual type:
- Legend — All three visuals support logos in the legend. Set Legend Display to "Logo and Text" or "Logo" in the Legend formatting card.
- Inside bars — The Column Chart can display logos inside bars. Set Bar Logo Placement to Center, Top, or Bottom in the Bar Settings card.
- End-of-line labels — The Line Chart shows logos alongside end-of-line labels when the legend position is set to "End of Line".
Python Script — Convert a Logo Folder to Excel
The following Python script scans a folder of image files and generates an Excel file with two columns: label (filename without extension) and logo (base64-encoded image).
"""
Convert a folder of logo images to an Excel lookup table.

Usage:
    python logos_to_excel.py <logo_folder> [output.xlsx]

Example:
    python logos_to_excel.py ./logos logos_table.xlsx
"""

import sys
import os
import base64
from pathlib import Path

try:
    import openpyxl
except ImportError:
    print("Install openpyxl first: pip install openpyxl")
    sys.exit(1)


SUPPORTED_EXTENSIONS = {".png", ".jpg", ".jpeg", ".gif", ".svg", ".webp"}

MIME_TYPES = {
    ".png": "image/png",
    ".jpg": "image/jpeg",
    ".jpeg": "image/jpeg",
    ".gif": "image/gif",
    ".svg": "image/svg+xml",
    ".webp": "image/webp",
}


def image_to_base64(file_path: Path) -> str:
    """Read an image file and return a data URI base64 string."""
    ext = file_path.suffix.lower()
    mime = MIME_TYPES.get(ext, "image/png")
    with open(file_path, "rb") as f:
        encoded = base64.b64encode(f.read()).decode("utf-8")
    return f"data:{mime};base64,{encoded}"


def main():
    if len(sys.argv) < 2:
        print(__doc__)
        sys.exit(1)

    logo_folder = Path(sys.argv[1])
    output_file = sys.argv[2] if len(sys.argv) > 2 else "logos_table.xlsx"

    if not logo_folder.is_dir():
        print(f"Error: '{logo_folder}' is not a valid directory.")
        sys.exit(1)

    # Collect image files
    images = sorted(
        f for f in logo_folder.iterdir()
        if f.is_file() and f.suffix.lower() in SUPPORTED_EXTENSIONS
    )

    if not images:
        print(f"No image files found in '{logo_folder}'.")
        sys.exit(1)

    # Create Excel workbook
    wb = openpyxl.Workbook()
    ws = wb.active
    ws.title = "LogosColors"
    ws.append(["label", "logo"])

    for img_path in images:
        label = img_path.stem  # filename without extension
        logo_b64 = image_to_base64(img_path)
        ws.append([label, logo_b64])
        print(f"  Processed: {img_path.name} → {label}")

    wb.save(output_file)
    print(f"\nDone! {len(images)} logos exported to '{output_file}'.")


if __name__ == "__main__":
    main()
Strongly recommended: resize your logo images before encoding them in base64.
Power BI loads the base64 string for every single data point in the visual. If your logos are high-resolution photographs (e.g. 1024×1024 at 300 DPI), the data model will become extremely large and Power BI will slow down dramatically.
Recommended settings for logos:
- Size: 32×32 to 64×64 pixels maximum
- Resolution: 72 DPI (screen resolution)
- Format: PNG with transparency, or SVG for vector logos
- File size: aim for under 5 KB per image after encoding
A 64×64 PNG icon is typically 2–4 KB in base64, while a 512×512 photo can exceed 200 KB. With 10 series and 50 data points, that's the difference between 1 MB and 100 MB of data loaded into memory.