Error Bars
Error bars display uncertainty or variability around data values. They appear in the Analytics pane.
Error Types
| Type | Description |
|---|---|
| By Percentage | Fixed percentage above/below each value |
| By Field | Upper and lower bounds from data fields |
| By Percentile | Percentile-based bounds |
| By Standard Deviation | Mean ± n standard deviations |
By Field
Drag measures into the Error Bar Upper Bound and Error Bar Lower Bound data wells. Set Relationship to:
- Absolute — the field values are the actual bound values
- Relative — the field values are offsets from the data value
Toggle Make Symmetrical to mirror the upper bound downward.
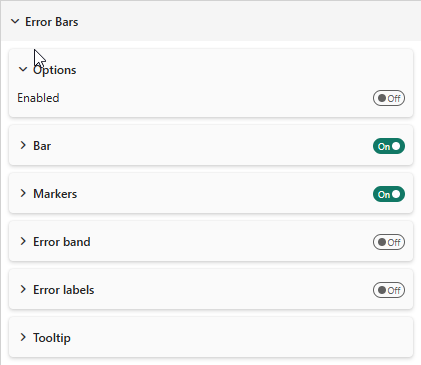
Display Options
Bar (Whisker)
| Property | Description | Default |
|---|---|---|
| Show Bar | Show the vertical whisker line | On |
| Match Series Color | Use series color for the whisker | On |
| Bar Color | Custom whisker color | #000000 |
| Width | Whisker line width | 1 |
| Border Color/Size | Cap styling | #000000 / 2 |
Markers
| Property | Description | Default |
|---|---|---|
| Show Markers | Show markers at bounds | On |
| Marker Shape | Line, Circle, Square | Line |
| Size | Marker size | 1 |
Error Band
| Property | Description | Default |
|---|---|---|
| Show Band | Show filled area between bounds | Off |
| Style | Fill and Line, Fill, Line | Fill and Line |
| Match Series Color | Use series color | Off |
| Band Color | Custom band color | #4682B4 |
| Transparency | Band opacity | 57% |
Labels
| Property | Description | Default |
|---|---|---|
| Show Labels | Display values at bounds | Off |
| Font | Label font settings | Segoe UI, 9px |
| Format | Absolute or Relative | Absolute |
| Background | Show background behind labels | Off |
Tooltip Format
Choose how error values appear in tooltips:
- Relative (numeric) — offset from the data value
- Absolute — actual bound values
- Relative (%) — percentage offset