Reference Lines
Reference lines appear in Power BI's Analytics pane and overlay statistical or constant values on the chart.
Available Lines
| Line Type | Description |
|---|---|
| Y Constant Line | A horizontal line at a user-defined value |
| Min Line | Line at the minimum value across all data points |
| Max Line | Line at the maximum value |
| Median Line | Line at the median value |
| Average Line | Line at the arithmetic mean |
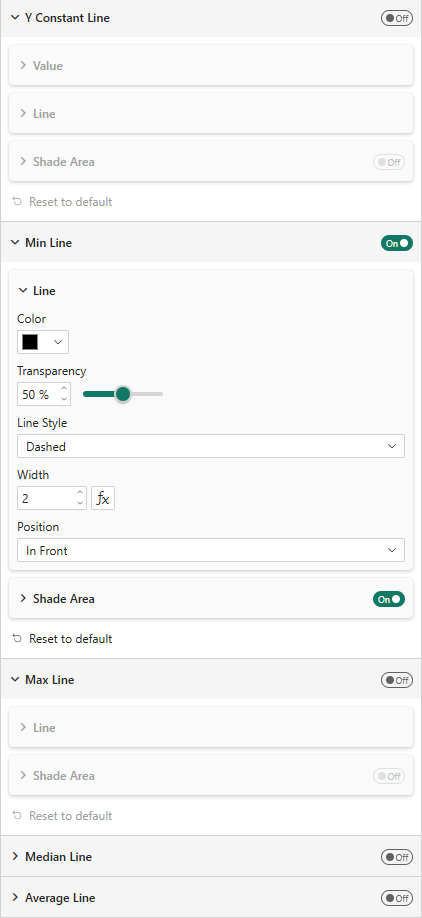
Common Properties
Each reference line has:
| Property | Description |
|---|---|
| Show | Toggle the line on/off |
| Line Color | Color of the line |
| Transparency | Line opacity (0–100%) |
| Line Style | Solid, Dashed, Dotted |
| Width | Line thickness (px) |
| Position | In Front or Behind the bars |
Shade Area
Each reference line can optionally shade the area above or below:
| Property | Description |
|---|---|
| Shade Area | Enable area shading |
| Position | Above or Below the line |
| Match Line Color | Use the line color for shading |
| Shade Color | Custom shade color |
| Transparency | Shade opacity |