Analytics (Line Chart)
The line chart supports the same analytics features as the column chart, plus additional line-specific features.
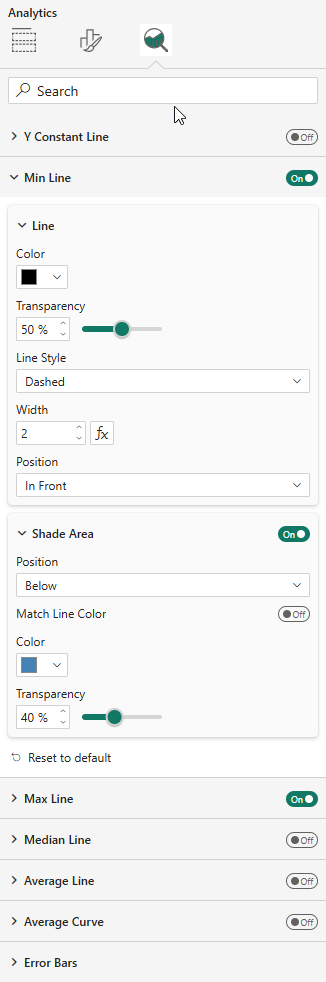
Reference Lines
Available in the Analytics pane:
- Y Constant Line — with configurable value (supports fx)
- Min Line, Max Line, Median Line, Average Line
Each line supports styling (color, style, width, position) and optional shade areas.
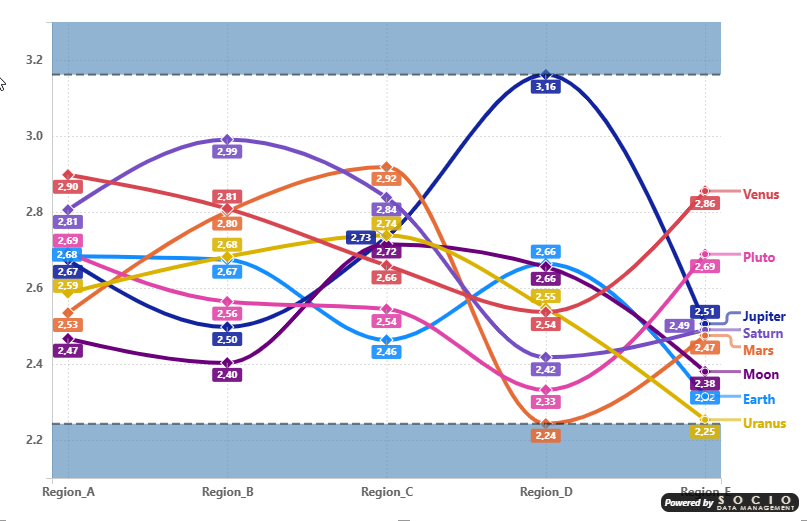
Shade Area Bands
A practical use of shade areas: enable both the Min Line and Max Line with their respective shade areas (shade below for Min, shade above for Max) to create a visual corridor that frames the data range. This clearly highlights the boundaries within which all data points fall.
Error Bars
Same four computation modes as the column chart:
- By Percentage, By Field, By Percentile, By Standard Deviation
With bar (whisker), marker, band, and label display options.
Average Curve
The line chart additionally supports an Average Curve that plots the average across all series for each category point.
Data Labels
The line chart supports two data label placement modes:
- Force Vertical — Labels stacked vertically above each data point
- Smart Placement — Automatic positioning to minimize overlaps with horizontal displacement
All data label settings (font, color, background, leader lines) support per-series customization through the "Apply settings to" dropdown. See the Data Labels formatting page for full details.