Axes
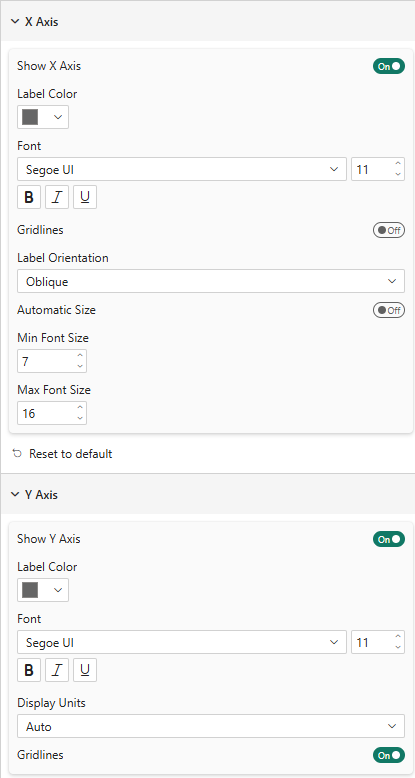
X Axis
| Property | Description | Default |
|---|---|---|
| Show | Show/hide the X axis | On |
| Label Color | Color of axis tick labels | #666666 |
| Font | Font family, size, bold, italic, underline | Segoe UI, 11px |
| Gridlines | Show vertical gridlines | Off |
| Label Orientation | Auto, Horizontal, Oblique, Vertical | Auto |
| Automatic Size | Auto-adjust font size to fit available space | Off |
| Min/Max Font Size | Bounds for automatic sizing | 7 / 16 |
Y Axis
| Property | Description | Default |
|---|---|---|
| Show | Show/hide the Y axis | On |
| Label Color | Color of axis tick labels | #666666 |
| Font | Font family, size, bold, italic, underline | Segoe UI, 11px |
| Display Units | Auto, None, Thousands (k), Millions (M), Billions (Mds) | Auto |
| Gridlines | Show horizontal gridlines | On |
In Bar and Stacked Bar modes, the axes swap roles: categories appear on the Y axis and values on the X axis. The formatting settings adapt automatically.
Multi-Level Axis (Hierarchy)
You can drag two or more fields into the Axis data well to create a hierarchical category axis. The visual renders each bar group at the leaf level (innermost field) and draws bracket labels below the axis for every parent level.
Example: drag Country then Planet into Axis:
- Individual bars are labeled by Planet (the leaf field)
- A bracketed span below groups them by Country (the parent field)
- Vertical separators mark the boundaries between countries
Drill-Down & Expand
When multiple fields are in the Axis well, Power BI's drill-down controls activate in the visual header:
| Control | Behaviour |
|---|---|
| Drill down (chevron ▼) | Shows only the next level — one field at a time |
| Drill up (chevron ▲) | Returns to the previous level |
| Expand all (two chevrons ▼▼) | Shows all levels simultaneously with bracketed group labels |
Place the outermost group (e.g. Country) first in the Axis well and the leaf items (e.g. Planet) last. The visual always uses the last field as the individual bar labels and all preceding fields as parent group brackets.
X Axis Hierarchy
This card appears in the formatting pane only when two or more fields are in the Axis well. It controls the bracket lines and vertical separators drawn below the axis tick labels.
Use the Group Separators toggle at the top of the card to show or hide all separator lines at once.
Lines
| Value | Description |
|---|---|
| Both | Draw horizontal brackets and vertical group separators |
| Horizontal only | Draw horizontal brackets and tick marks only (no vertical dividers) |
| Vertical only | Draw vertical separators only (no horizontal brackets) |
Appearance
| Property | Description | Default |
|---|---|---|
| Color | Line color | #666666 |
| Transparency | Line opacity (0–100%) | 50% |
| Line Style | Solid, Dashed, Dotted | Solid |
| Width | Line thickness (px) | 1 |
The vertical separator is drawn at the midpoint of the gap between the last bar of one group and the first bar of the next, regardless of bar padding, so it always falls exactly between the two groups.