Data Labels
The Data Labels card controls value labels displayed on or near each bar.
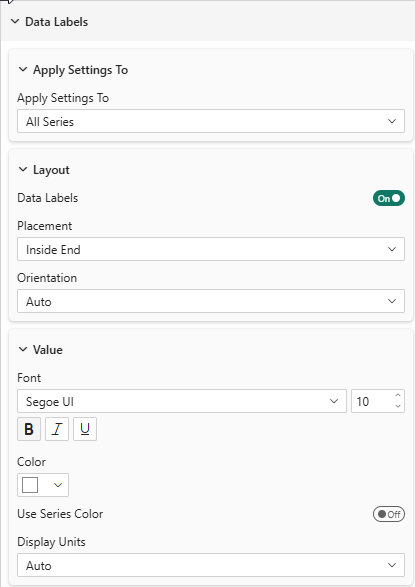
Layout
| Property | Description | Default |
|---|---|---|
| Placement | Outside End, Inside End, Inside Center, Inside Base | Outside End |
| Orientation | Auto, Horizontal, Vertical | Auto |
Auto Orientation
In Auto mode:
- Column mode: text rotates vertically when the label width exceeds the bar width
- Bar mode: text always stays horizontal (bars have plenty of length)
Value Formatting
| Property | Description | Default |
|---|---|---|
| Font | Font family, size, bold, italic, underline | Segoe UI, 10px |
| Color | Label text color | #333333 |
| Use Series Color | Color labels to match their series | Off |
| Transparency | Text opacity (0–100%) | 0% |
| Display Units | Auto, None, k (thousands), M (millions), Mds (billions) | Auto |
| % Decimals | Number of decimal places for percentage labels (0–4). Only visible in 100% Stacked modes. | 1 |
The visual also respects the format string defined on each measure in your data model (number of decimal places, currency symbols, etc.).
In 100% Stacked modes, percentages are rounded using the largest remainder algorithm so that the displayed values always sum to exactly 100% per category — even with 0 decimal places. For example, three equal parts display as 34% + 33% + 33% = 100%, not 33% + 33% + 33% = 99%.
Background
| Property | Description | Default |
|---|---|---|
| Background | Show a background rectangle behind labels | Off |
| Color | Background color | #FFFFFF |
| Use Series Color | Match background to series color | Off |
| Transparency | Background opacity (0–100%) | 20% |
Per-Series Visibility
The Data Labels Visibility sub-card lets you control which series display labels:
- All Series toggle (ON by default) — shows labels for all series
- When All Series is turned OFF, individual toggles appear for each series
- Toggle specific series ON/OFF to show/hide their labels independently
This is useful when you have many series but only want to highlight a few with labels.
Staggered Labels (Stacked Mode)
When labels overlap in stacked charts, the visual automatically staggers them horizontally (for vertical charts) or vertically (for horizontal charts):
- Labels that have enough vertical space remain centered
- Overlapping labels are distributed across multiple columns within the bar width
- The number of columns is calculated based on the bar width and the widest label