Zoom Inset
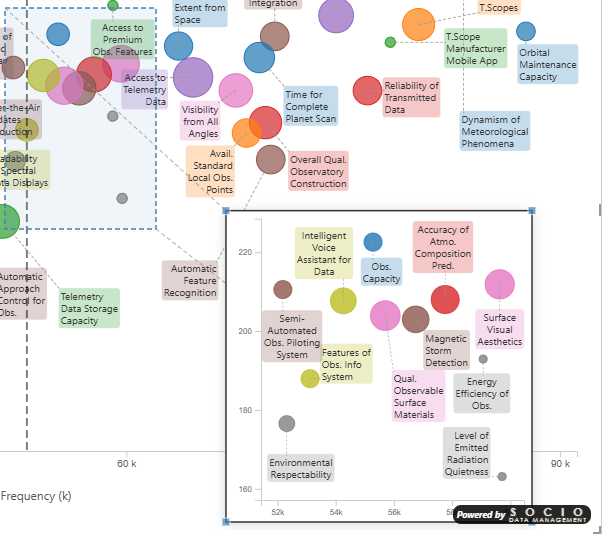
The zoom inset is one of the most distinctive features of the Smart Scatter Plot. It magnifies a selected rectangular region of the chart and displays it as an enlarged inset — making it easy to explore dense clusters of points without losing the overall context.
Unlike features that only work in edit mode, the zoom inset is fully interactive in reading mode. Report consumers can explore dense data areas without any editing permissions. This makes it ideal for published reports and dashboards.
Properties
| Property | Description |
|---|---|
| Zoom Active | Enable/disable the zoom inset |
| Source X/Y | Top-left corner of the source region (%) |
| Source Width/Height | Size of the source region (%) |
| Inset X/Y | Position of the magnified view (%) |
| Inset Width/Height | Size of the magnified view (%) |
All values are percentages of the plot area (0–100). Because values are expressed as percentages, the zoom inset maintains its relative position and size when the chart is resized or printed at a different resolution.
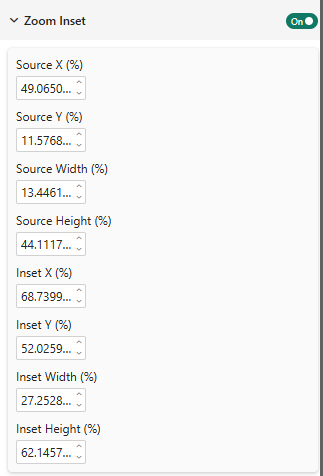
In most cases, you do not need to set these values manually. When the zoom inset is enabled, you can drag and resize both the source region and the inset window directly on the chart. The percentage values update automatically. Manual entry is only useful when you want to replicate the exact same zoom configuration across multiple charts.
The zoom inset relies on a numeric, invertible scale, so it is available only when both axes are continuous (measures). It is automatically hidden when either axis carries categories.
Zoom Inset in action
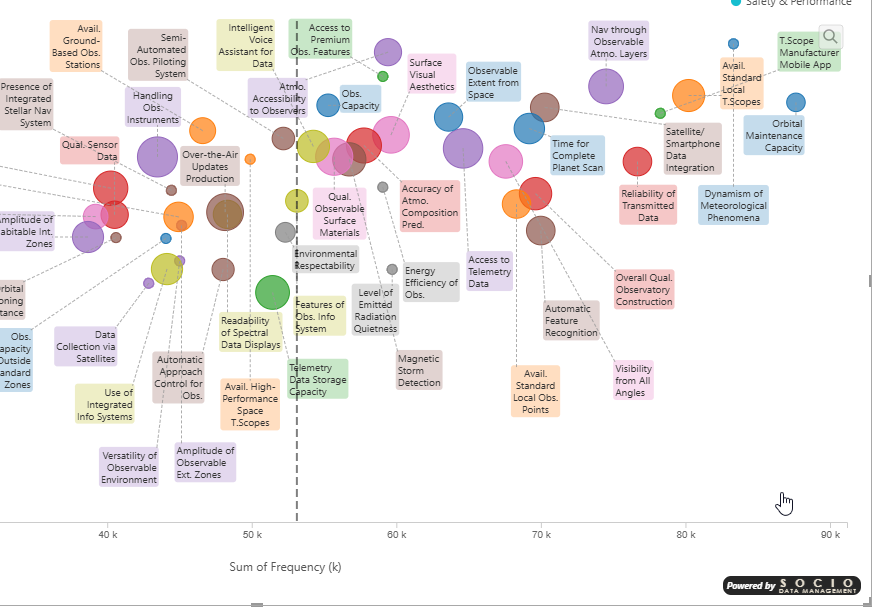
Without zoom, dense clusters make it hard to read individual labels:
With the zoom inset enabled, the dense area is magnified and labels are much easier to read: